
An Interactive Tool to Identify Severe Crash Areas
Project Overview
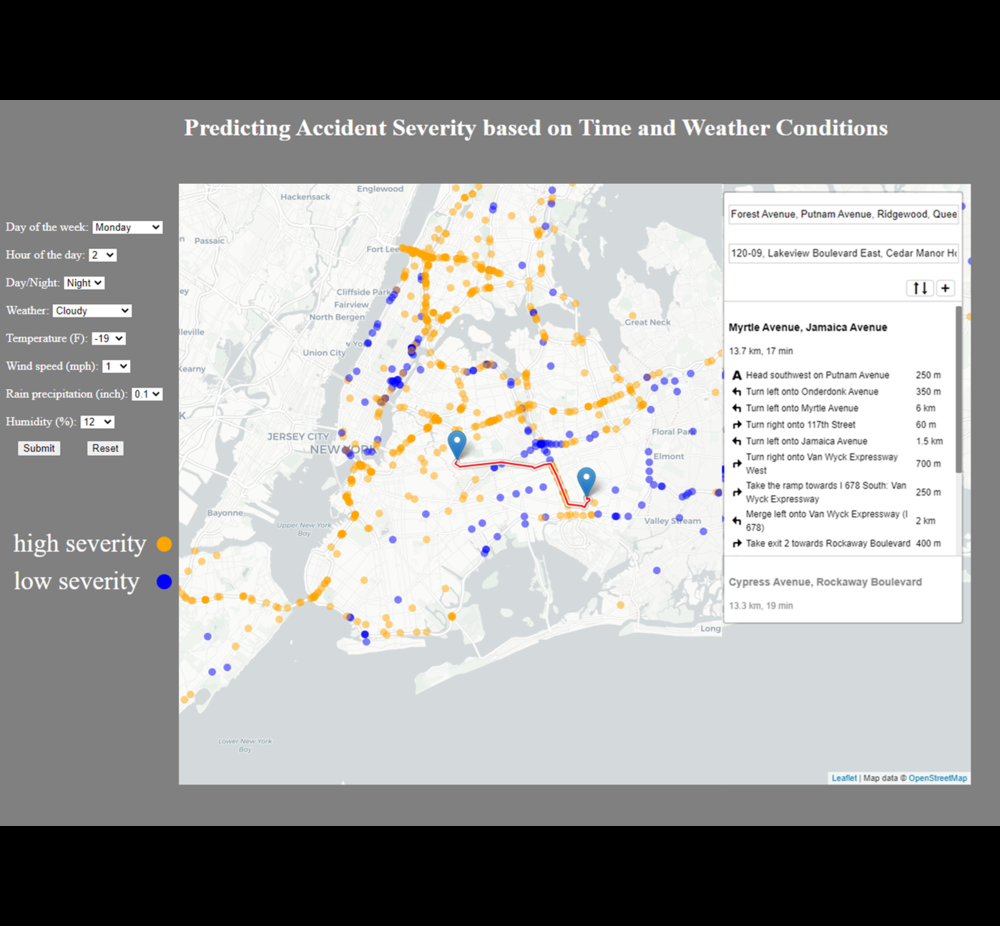
Crash Map is an interactive tool to identify areas on a map that have a high risk
for accidents based on historical data.
To create Crash Map, I collaborated with 5 team members and leveraged the
following tools:
- D3, a JS library, to create the interactive map framework and GUI
- Leaflet, a JS library, to handle the routing and navigation on the map
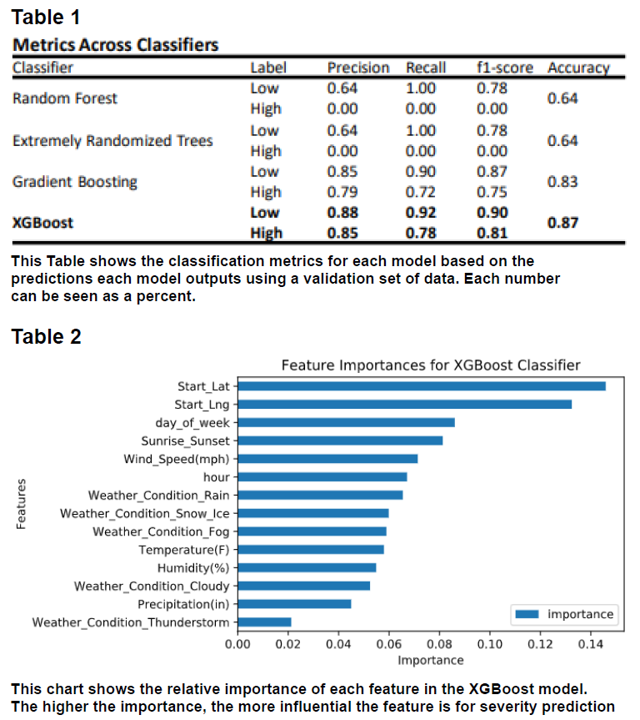
- XGBoost, a Python implementation for gradient boosted decision trees, to label severity of locations based on historical crash data (location, time, and weather)
- Flask, a Python web framework module, that facilitated data for visualization to D3 and Leaflet
How to Use Crash Map
- Go to Crash Map
- NOTE: Crash Map is hosted on Railway.app.
- Select values for each of the fields
- Click Submit
- The map should be populated with points predicting accident severity based on historical data. (The fields may need to be filled/submitted twice. TODO: Fix this bug)
- A route can then be selected on the map to view the potential impact of weather on the trip. (TODO: add functionality to reroute to avoid high risk areas)
Detailed Writeup and Future Work
- Update hosting and interface of Crash Map to be more stable, responsive and user-friendly
- Add information for other locations rather than being restricted only to NY
- Add crash likelihood predictions in addition to crash severity
- Collect new information to add to the existing dataset
- Bug fixes